
|
Chart In general, a chart is a graphical representation of data. Charts allow users to see what the results of data to better understand and predict current and future data. For example, how much data has been using a day by users in a network? Microsoft Word offers several graphing tools such as pie charts, scatter graphs, and stock charts to help users create infographics and data visualizations. You don’t have to start in Excel to add an Excel chart to a Word document. Instead, you can create the Excel chart from scratch in Word and edit the data and customize the chart right there. Once your chart is in place, you can change colors, styles, details, components, and data as much and as often as you want. As I mentioned on the top, when you work with data entry, there are different types of the data entries to do so, if you have data to analyze through a chart visual then only you can use chart tool to create and insert a chart to the document. How to insert a pie chart for Result of the parties who are participated in election 2017? Keep the cursor wherever you want to insert the chart => Select Insert Menu => Click Chart Tool => Select Pie Chart => Click OK => Now type your data in the Excel sheet and then after you get the chart visual, Close the Excel sheet. For more understanding, look at the screenshot please: 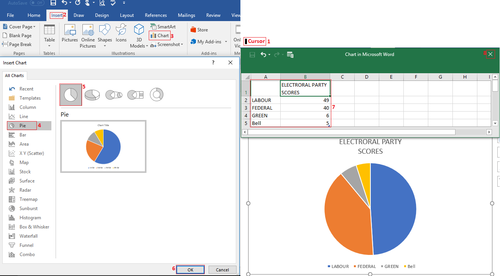 Screenshot: Nowadays screenshot is essential to guiding something important notes to others because it’s easy way to understanding that what is exactly happening on the screen or trying to tell someone else. When you would like to have a screenshot of the things you view on the screen, you can use this command to get a screenshot or clip and inert into the document, where you are needed. How to insert a screenshot/clip in an active document? Select Insert Menu => Click Screenshot => Click Screen clipping =>Draw the area that you need for clip. For more understanding, look at the screenshot please: 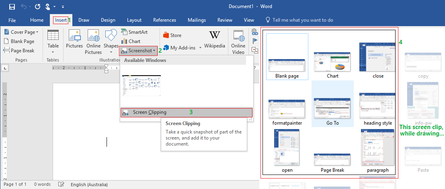
0 Comments
|
Archives |
 RSS Feed